Column Chart in DataInsider
- Tracy Tran
- Jul 31, 2021
- 1 min read
Updated: Aug 21, 2021
Index
1. What is a Column Chart?
2. When to use a Column Chart?
3. Step By Step Guidance with DataInsider
1. What is a Column Chart?
A bar chart compares two or more variables with the same unit of measure and are of comparable sizes. In other words, it displays categorical data with rectangular bars whose length or height corresponds to the value of each data point.
2. When to use Column Chart?
A Column Chart is the reversed version of a Bar Chart. Besides being used for visualizing purposes like Bar Charts, this type of graph is also ideal for tracking change over time.


Data source: Vietnam General Statistics Office
3. Step By Step Guidance with DataInsider
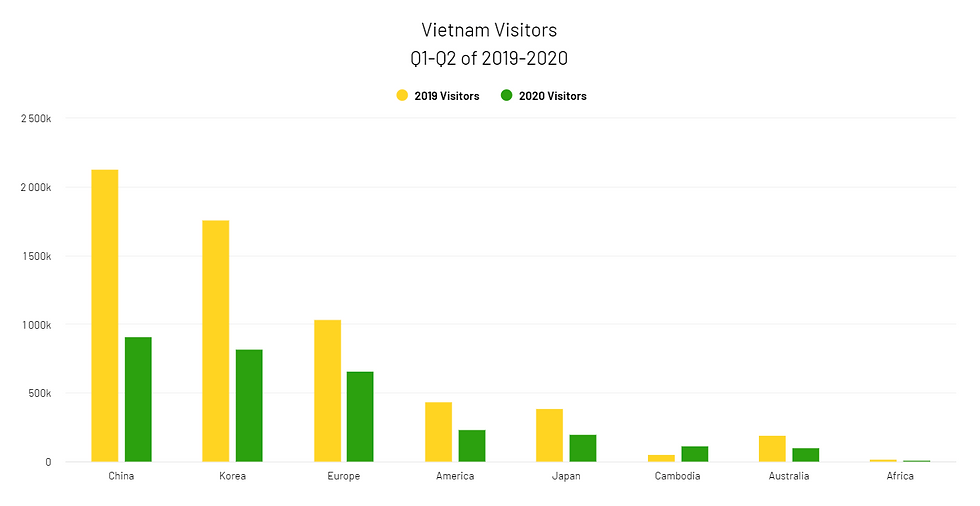
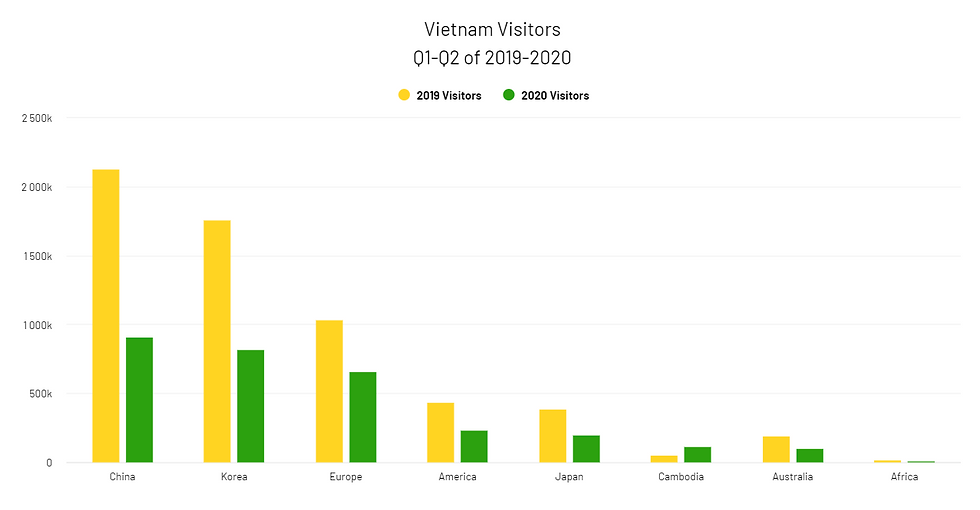
Desired chart: A column chart displaying and comparing the number of visitors to Vietnam in Q1 and Q2 of 2019 and 2020
Step 1. Drag Region to X-Axis
Step 2. Drag 2020 Visitors , 2019 Visitors to Y-Axis
Step 3. Drag 2020 Visitors to Sorting -> Descending

Result:

Comentarios